

|
|
Line Scan
This will create a dashed horizontal line. Pixel information and a visual representation of the dark and light pixels will be displayed below the image.
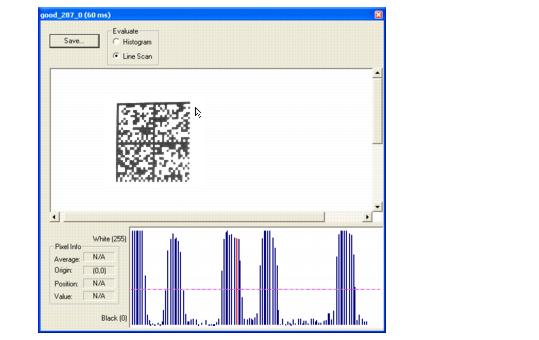
When you center your cursor over the dashed line, it becomes a double arrow cross. This allows you to move the line anywhere in the window. You can also use your keyboard arrows to move the line incrementally in any direction.
As with the histogram, the line scan compares light and dark pixels, but in a spatial distribution.
When you click anywhere on the graph, a vertical red line appears at that point and its position and value (in terms of black-to-white) are updated in the Pixel Info table to the left of the graph. In addition, a horizontal dashed red line is displayed that indicates the average value.
|
|